Gayness Chart: How to Read Sexuality Scales Without Boxing Yourself In
A gayness chart can look comforting when your feelings feel hard to name. A simple line, pie chart, quiz result, or Kinsey scale chart seems to promise order: straight on one side, gay on the other, and maybe a few shades in between. The useful part is that a chart can give you language for reflection. The risky part is treating it like a final verdict. If you are questioning your sexuality, a chart should help you notice patterns, not pressure you into a label before you are ready. You can also use a private orientation self-reflection tool as one gentle starting point, as long as you keep the same rule in mind: tools support reflection; you define yourself.
What People Usually Mean by a Gayness Chart
When people search for a gayness chart, they are often looking for one of three things.
First, they may mean the Kinsey Scale: the familiar 0 to 6 scale that describes a range from exclusively heterosexual to exclusively homosexual, with middle numbers representing different mixtures of attraction or behavior. Second, they may mean an online quiz chart, such as a pie chart that breaks results into straight, bisexual, gay, queer, or questioning categories. Third, they may mean a social-media chart or meme, such as a "gay alignment chart," "gay type chart," or "types of gay men chart."
Those formats are not equal. A research scale, a self-reflection quiz, and a meme are built for different purposes. A research scale tries to organize data. A quiz tries to prompt personal reflection. A meme usually plays with culture, humor, aesthetics, or identity language. Problems start when a playful chart gets treated like evidence, or when a simple scale gets asked to explain every part of a person's attraction, history, culture, and future.
The most helpful way to read any chart is to ask: What is this chart actually measuring? Is it asking about sexual attraction, romantic attraction, behavior, fantasy, identity, community, or style? A chart that mixes all of those together may still be interesting, but it cannot give a clean answer to a complex question.
The Kinsey Scale Chart, in Plain English
The best-known sexuality chart is the Kinsey Scale, first published in the Kinsey Reports in the mid-20th century. It is commonly shown as a 0 to 6 line:
| Number | Common meaning |
|---|---|
| 0 | Exclusively heterosexual |
| 1 | Predominantly heterosexual, only incidentally homosexual |
| 2 | Predominantly heterosexual, but more than incidentally homosexual |
| 3 | Equally heterosexual and homosexual |
| 4 | Predominantly homosexual, but more than incidentally heterosexual |
| 5 | Predominantly homosexual, only incidentally heterosexual |
| 6 | Exclusively homosexual |
| X | No socio-sexual contacts or reactions in the original research context |
In everyday searches, people often ask about "Kinsey scale 1," "Kinsey scale 4," or "Kinsey scale 5" because they want to know where their feelings might fit. A Kinsey scale 1 usually suggests mostly heterosexual patterns with some same-sex attraction or behavior. A Kinsey scale 4 usually suggests mostly same-sex attraction or behavior with some other-sex attraction or behavior. A Kinsey scale 5 usually suggests a strongly same-sex pattern with only incidental other-sex attraction or behavior.
But there is an important limitation: there is no official Kinsey scale test online. The original number was assigned from research interviews, not from a quick quiz. That does not mean every Kinsey-style quiz is useless. It means a quiz result should be read as a reflection prompt, not as proof. If an online chart gives you a number, the better follow-up is not "Is this number my identity forever?" It is "Which answers led to this number, and do those answers match how I understand myself?"
Why a Single Score Can Miss Important Parts of Attraction
A one-line gayness chart can be useful because it is simple. It can also be incomplete for the same reason.
Sexual orientation can include several layers. Sexual attraction is about who you feel sexually drawn to. Romantic attraction is about who you want closeness, dating, love, or partnership with. Behavior is about what you have done. Identity is about the word or words that feel right to you. These layers often overlap, but they do not always match perfectly.
For example, someone might feel romantic attraction toward men and women but only rarely experience sexual attraction. Another person might have had mostly heterosexual relationships while privately recognizing recurring same-sex attraction. Someone else may identify as gay because it feels socially and emotionally true, even if their past behavior looks mixed on a chart.
This is why "Are there different levels of gayness?" is a tricky question. There can be different degrees, patterns, and contexts of attraction. But people are not better understood as being ranked by "levels." A chart can describe intensity or direction. It should not turn identity into a scorecard.
If you use the Gay Test self-reflection experience, focus on the questions that make you pause. Your pauses often say more than a percentage. Which scenarios feel familiar? Which answers feel easy? Which answers feel like something you have avoided admitting, even to yourself? That kind of noticing is more useful than trying to win a label from a chart.
Gay Test Pie Charts and Quiz Charts: How to Read Them Safely
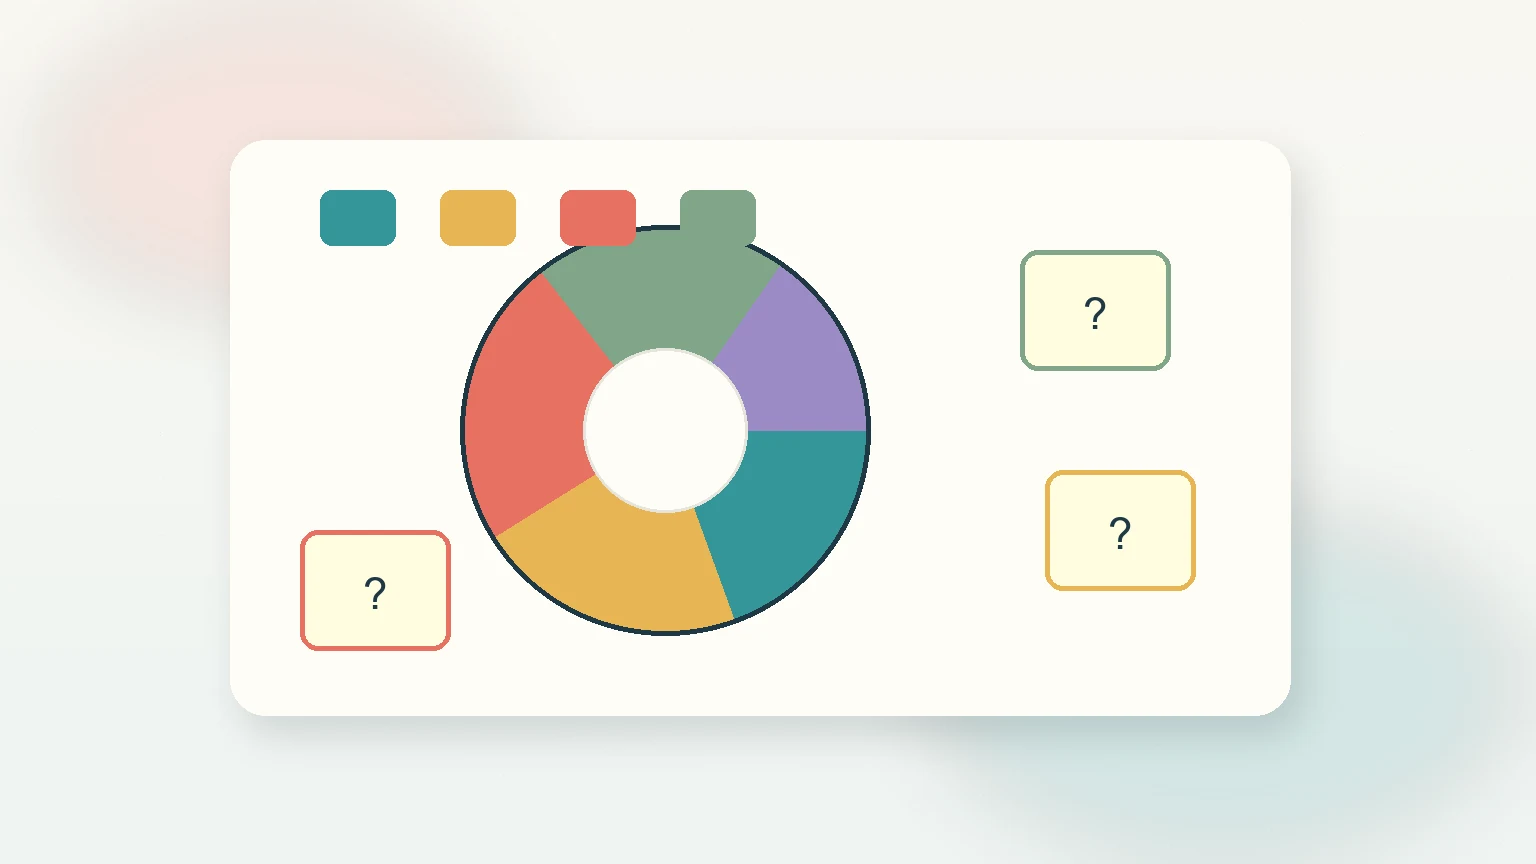
Many online sexuality quizzes present results as a pie chart: perhaps 40 percent bisexual, 35 percent gay, 15 percent straight, and 10 percent questioning. Visually, that can feel precise. Emotionally, it can feel like relief or panic, depending on what you expected.
Read those charts gently. A pie chart is usually showing how your answers matched a quiz's categories. It is not measuring the full truth of your life. The categories may be broad. The scoring may weigh certain questions more than others. The result may reflect your mood, recent crushes, what you felt comfortable admitting, or how the quiz writer defined each label.
A safer way to read a gay test pie chart is to translate it into questions:
- What part of the result felt accurate?
- What part felt wrong, exaggerated, or too narrow?
- Did the chart separate romantic attraction from sexual attraction?
- Did it ask about identity, behavior, fantasy, and emotional closeness separately?
- Did it leave room for bisexual, pansexual, asexual, queer, questioning, or fluid experiences?
If the answer is no, the chart may still be useful as a conversation with yourself. It is just not the whole conversation.
What About LGBTQ+ Population Charts?
Some searches for gayness chart lead to population charts, such as "what percentage of the population is LGBTQ+?" These charts answer a different question. They are not about your personal orientation; they are about how many people identify as LGBTQ+ in a survey.
Survey numbers vary because identity is personal and social. Some people are open in anonymous surveys but not in public. Some countries have safer environments for LGBTQ+ self-identification than others. Some surveys ask about sexual orientation only, while others include gender identity. Some ask about identity labels, while others ask about attraction or behavior. These choices can change the numbers.
Recent U.S. polling has estimated that roughly 9 percent of U.S. adults identify as LGBTQ+, while other research using different methods has produced different estimates. Cross-country surveys also vary widely. So when people ask whether rates of homosexuality are increasing, the careful answer is: public identification appears to have increased in many surveys, especially among younger adults, but that does not prove that human attraction itself suddenly changed. It may also reflect safer disclosure, broader vocabulary, generational differences, and more people recognizing bisexual, queer, pansexual, asexual, and other identities.
For the question "What country has the highest rate of homosexuality?" be cautious. A country ranking usually measures survey self-identification, not a complete count of everyone's private attraction. Cultural safety, legal protections, stigma, survey design, and translation all affect the result.
A Better Personal Chart: Map Attraction, Identity, and Comfort Separately
Instead of asking one chart to answer everything, try making a small private map with three columns.
| Area to reflect on | Questions to ask yourself | What to notice |
|---|---|---|
| Attraction | Who do I feel drawn to romantically or sexually? | Patterns, exceptions, intensity, change over time |
| Identity language | Which words feel possible, neutral, exciting, or uncomfortable? | Labels that feel supportive rather than forced |
| Comfort and safety | Where do I feel safe exploring these thoughts? | Trusted people, private journaling, supportive resources |
This kind of chart is less flashy than a quiz graphic, but it is often more honest. It lets you separate what you feel from what you call it. It also leaves room for uncertainty. You might know you are attracted to men but not know whether gay, bi, queer, questioning, or another word fits. You might know a label fits privately but not feel ready to share it. Both are normal places to be.
You can update this chart over time. Try revisiting it after a few weeks, after a meaningful crush, after a conversation with a trusted person, or after reading more about sexual orientation. If the map changes, that does not mean you were wrong before. It may mean you are learning more.
How to Use a Gayness Chart Without Boxing Yourself In
Use a chart as a mirror, not a cage.
Start by naming the chart's purpose. Is it educational, research-based, playful, or quiz-based? Then notice what it leaves out. Does it include romantic attraction? Does it include asexuality? Does it allow bisexuality to be more than "half straight, half gay"? Does it respect that identity can be personal, cultural, and fluid?
Next, watch your emotional reaction. Relief, curiosity, resistance, sadness, excitement, or fear can all carry information. None of those feelings require an immediate public decision. If a result makes you anxious, step back from the chart and return to your real experiences. Who have you liked? Who do you imagine being close to? Which labels feel spacious rather than restrictive?
Finally, talk to someone supportive if the question feels heavy. That might be a trusted friend, an LGBTQ+ community resource, or a qualified mental health professional. A chart can organize thoughts, but support from real people can help you feel less alone.
When a Chart Is Helpful, and When to Set It Down
A gayness chart is helpful when it gives you vocabulary, reduces shame, or helps you compare different kinds of attraction. It is also useful when it reminds you that sexuality is not always a strict either-or.
Set the chart down when it makes you obsess over tiny score differences, when it encourages stereotypes, or when it tells you that one number should decide your whole identity. Also set it down if you keep retaking quizzes to chase certainty. Reflection can be healthy; compulsive checking can make confusion louder.
Before you close the tab, choose one grounded next step. You might write down three attraction patterns you have noticed. You might read about the difference between romantic and sexual attraction. You might explore a gentle sexuality exploration quiz and treat the result as a starting note, not a final label. Or you might simply give yourself permission to not know yet.
The best chart is the one that helps you understand yourself with more kindness. If a chart does the opposite, you are allowed to leave it behind.
FAQ
What is the gayness scale?
"Gayness scale" is an informal phrase. People usually use it to mean the Kinsey Scale, a Kinsey-style online quiz, or a chart that places attraction somewhere between heterosexual and homosexual. It can be useful as a simple visual, but it should not be treated as a complete identity answer.
Is there an official Kinsey scale test online?
No. The original Kinsey Scale was based on research interviews, not a public online test. Online Kinsey-style tests may help you reflect, but they are not official Kinsey Institute assessments.
What does Kinsey scale 4 mean?
In common Kinsey Scale language, 4 means predominantly homosexual, but more than incidentally heterosexual. In plain English, it suggests a mostly same-sex pattern with some other-sex attraction or behavior. A number can describe a pattern, but it does not have to decide your label.
What does Kinsey scale 5 mean?
Kinsey scale 5 usually means predominantly homosexual, only incidentally heterosexual. Someone might read that as strongly gay-leaning, but personal identity still depends on how the person understands their attraction, history, and language.
Are rates of homosexuality increasing?
Public LGBTQ+ identification has increased in several surveys, especially among younger adults. That may reflect safer disclosure, broader identity language, and changing social attitudes. It does not necessarily mean human attraction itself has newly appeared or changed in a simple way.
Are there different levels of gayness?
There can be different patterns and intensities of attraction, but "levels" can sound like a ranking system. It is usually kinder and more accurate to talk about attraction patterns, identity language, and comfort rather than levels.
What country has the highest rate of homosexuality?
There is no perfect global answer. Country rankings usually depend on survey self-identification, and results are shaped by safety, stigma, laws, culture, and survey wording. A high number may mean people feel safer being honest, not that one country has a completely different kind of population.